Supply Dynamics and Import Mix Evolution
During July 2026, gas quantities entering the National Natural Gas Transmission System (NNGTS) recorded a significant increase. On a monthly basis, volumes ascended by 23%, rising from approximately 5.7 TWh in June to 7 TWh. A similar trend is evident in the cumulative Year-to-Date (YTD) performance, which saw a 13% growth from the 45 TWh recorded in the same period last year to a current cumulative total of 50 TWh. This consistent trajectory underscores a deepening reliance on natural gas as a primary energy pillar during peak periods.
This aggregate growth provides the necessary baseline to examine the specific shifts in the underlying supply mix, where a strategic rebalancing between pipeline imports and Liquefied Natural Gas (LNG) is currently unfolding.
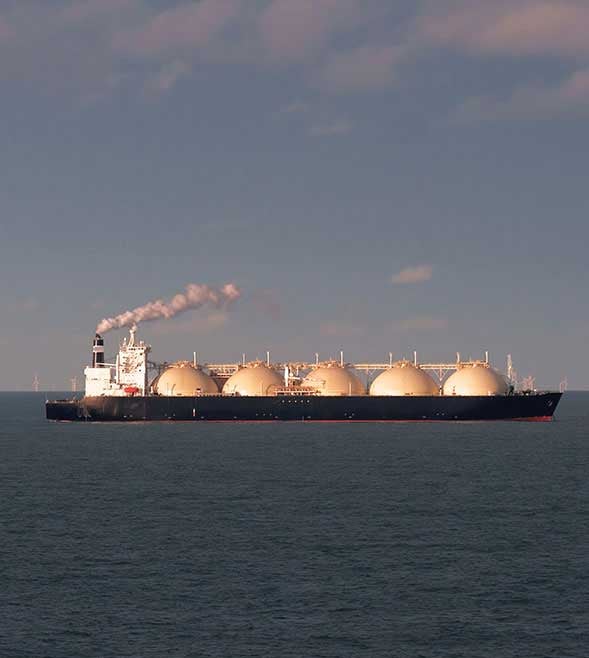
The market witnessed a distinct pivot back toward pipeline gas in July, which accounted for 60% of total monthly imports (approximately 4.3 TWh). This represents a substantial 70% surge in pipeline volumes on a MoM basis. Conversely, LNG imports experienced a 12% MoM slip, falling to approximately 2.8 TWh (40% of the total mix). This shift highlights the system's tactical ability to flex between sources based on seasonal availability and strategic inventory management.
The performance of specific entry points illustrates the nuanced nature of current supply strategies:
- Pipeline Dynamics: While the Nea Mesimvria point (TAP) remained stable with a marginal 1% YoY increase, the Sidirokastro entry point saw a 5% YoY decline in YTD volumes (falling from 19.8 TWh to 18.8 TWh), reflecting the structural transition away from Russian gas dependencies.
- LNG Diversification: The Agia Triada (Revithoussa) terminal remains the LNG anchor despite a 1 TWh MoM dip. Crucially, the Amfitriti terminal has emerged as a high-growth asset; following scheduled maintenance, it recorded a staggering 287% YoY surge in cumulative performance, reaching a YTD total of 4 TWh.
Strategic Implications of Entry Point Shifts:
- Phase-Out Execution: The 5% YTD decline at Sidirokastro confirms a deliberate, structured withdrawal from legacy pipeline dependencies in favor of diversified alternatives.
- Infrastructure Validation: The 287% cumulative surge at the Amfitriti terminal validates recent FSRU investments as vital components of national supply elasticity.
- Systemic Resilience: The successful return of Amfitriti to operation ensures that the 12% MoM slip in LNG was a controlled maintenance-related adjustment rather than a failure of supply security.
As the supply mix stabilizes, the focus shifts from how gas enters the country to how it is consumed by primary domestic and international sectors.
Sectoral Demand and Export Dynamics
Understanding the evolving demand structure—particularly the interplay between domestic power requirements and Greece’s ascending regional export role—is vital for long-term infrastructure planning.
Power generation remains the undisputed leader of domestic consumption, accounting for 62% of total exit quantities (~4.3 TWh). This sector experienced 12% MoM growth, a spike primarily attributed to peak summer cooling loads. Despite a slight 3% YoY decline in YTD volumes (~25.8 TWh) caused by increased hydro penetration in the spring and limited Battery Energy Storage System (BESS) deployment, gas-fired power remains the indispensable backbone of the Greek grid during high-load periods.
Greece strengthens its position as a regional gas hub as exports surge
In a watershed moment for Greek energy strategy, the country's role as a regional provider has reached a new level. Export volumes doubled MoM (from 0.7 TWh to 1.5 TWh), while cumulative year-to-date exports nearly tripled on year-on-year basis, skyrocketing from 3.5 TWh to 10.2 TWh.
In contrast to the growth in power and exports, the Industrial sector saw a 9% MoM decline to 0.6 TWh. This downturn is linked to geopolitical instability and higher inventory costs, which have begun to weaken the competitive positioning of industrial products.
Regional Distribution and Customer segmentation
The expansion of local networks, primarily through Enaon EDA, serves as a critical metric for economic development and residential energy penetration across the Greek territory.
Consumption remains concentrated within the nation's main industrial and administrative centers. Attica and Central Greece continue their combined dominance, leading total distribution consumption with approximately 294 GWh. Across the wider distribution network, industrial use remains the primary driver, accounting for a commanding 83% share of total demand.
A notable paradox has emerged within the residential sector that warrants executive attention:
- Points of Delivery (PoDs): There has been a 4% YoY increase in activated PoDs, representing 26,000 new connections.
- Consumption Stability: Despite the increase in physical connections, residential consumption remained stable at 3,792 GWh YoY.
- The Inflation Influence: While the network is physically expanding, actual household consumption is being contained by inflationary pressures and the "summer break" effect on hot water use.
Download the detailed report