Greek Natural Gas Market report | July 2026
ENERGY & RESOURCESDuring July 2026, gas quantities entering the National Natural Gas Transmission System (NNGTS) demonstrated significant upward momentum.
28 Sep 2026 5 min read

The strategic resilience of the Greek gas market is predicated on the optimization of its supply dualism: the baseline stability of fixed pipeline infrastructure and the high-degree flexibility afforded by LNG imports.
For August 2026, the supply mix reflects a dominant reliance on pipeline corridors, supported by a substantial LNG buffer:
| Supply Source | Quantity (TWh) | Share of Total Imports (%) |
|---|---|---|
|
Pipeline Gas |
4.3 |
59% |
|
Liquefied Natural Gas (LNG) |
3.0 |
41% |
This 59/41 split illustrates a robust market posture. While the 59% share of pipeline gas provides a predictable, high-volume foundation, the 41% LNG share provides the agility required to pivot toward global markets when pipeline dynamics shift.
An analysis of entry point dynamics further clarifies the physical flow of energy. Within the pipeline segment, Sidirokastro remains the primary artery, channeling approximately 3.7 TWh (87%) of pipeline gas (predominantly of Russian origin). Nea Mesimvria, the entry point for the Trans Adriatic Pipeline (TAP), contributed the remaining 0.6 TWh (13%).
Identifying the trajectory of the market requires a granular comparison of Year-over-Year (YoY) structural shifts against Month-over-Month (MoM) seasonal volatility.
On a YoY basis, total NNGTS gas quantities strengthened by 13%, climbing from approximately 51 TWh to 57 TWh. This expansion was driven by three primary infrastructure catalysts:
Short-term MoM metrics highlight the system’s operational resilience. While total NNGTS quantities rose 3%, LNG imports outperformed this trend with a 6% increase.
Greece has successfully pivoted from a terminal market into a high-functioning regional energy hub. This transformation is driven by the "cannibalization" of domestic supply capacity by an aggressive export strategy, fundamentally altering the NNGTS demand profile.
The most defining metric of the period is the tripling of exports YoY, which surged from ~4.5 TWh to ~12 TWh. This surge is the primary driver behind the 13% YoY increase in total imports; while domestic national consumption remained relatively stable at ~46 TWh, the NNGTS is being leveraged primarily to facilitate regional transit.
The August 2026 demand hierarchy follows this allocation:
The data reveals a strategic decoupling: while total imports are rising, domestic power generation is becoming more efficient or being displaced by the focus on the export market, confirming Greece's priority as a provider of regional energy security.
Detailed monitoring of regional consumption and technical Points of Delivery (PoD) is essential for refining retail strategies and network planning. In August 2026, the distribution landscape was defined by industrial concentration and the impact of inflation on residential behavior.
Attica and Central Greece remain the primary consumption nodes, combined at ~234 GWh. Industrial use remains the dominant driver of distribution, accounting for 82% of total demand. Notably, the 11% increase in industrial consumption was supported by a tangible expansion of end-users base, with activated industrial users growing from 353 to 376.
A critical insight emerges from the retail segment: despite the activation of 26,788 new Points of Delivery (PoD)—a 4% expansion of the network—actual residential consumption remained largely contained. This suggests that while infrastructure reach is expanding, individual household consumption is being suppressed by inflationary pressures.
Regional network performance diverged sharply:
MoM trends were dictated by the "summer break" effect. Residential and commercial sectors dropped 17-18% due to reduced hot water and business activity, while the industrial segment saw a 19% drop (reaching 457 GWh) as plants initiated scheduled preventive maintenance during the holiday hiatus.
The August 2026 performance metrics confirm that Greece has successfully matured into a diversified, export-oriented energy hub. The market's stability is anchored by the resilience of traditional pipeline routes, but its future growth is clearly tied to the scaling of LNG and FSRU infrastructure at Amfitriti and Agia Triada.
The tripling of exports YoY serves as definitive proof of Greece’s successful energy hub evolution, by maintaining a high LNG buffer and utilizing multiple interconnected entry points, Greece is positioning itself as a vital provider of security for the wider Balkan and European regions.
Subscribe here to receive our newsletters




During July 2026, gas quantities entering the National Natural Gas Transmission System (NNGTS) demonstrated significant upward momentum.
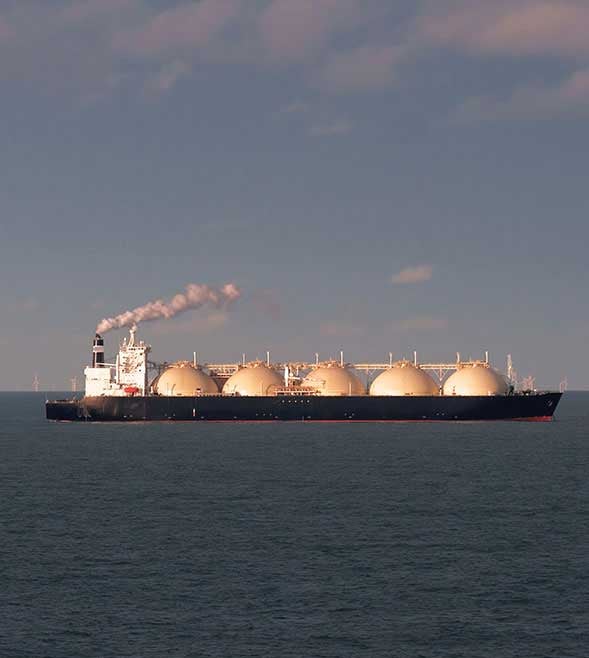
Greece is currently navigating a fundamental strategic shift in its energy sourcing, characterized by a transition from traditional pipeline-heavy reliance toward a flexible, LNG-centric import model.
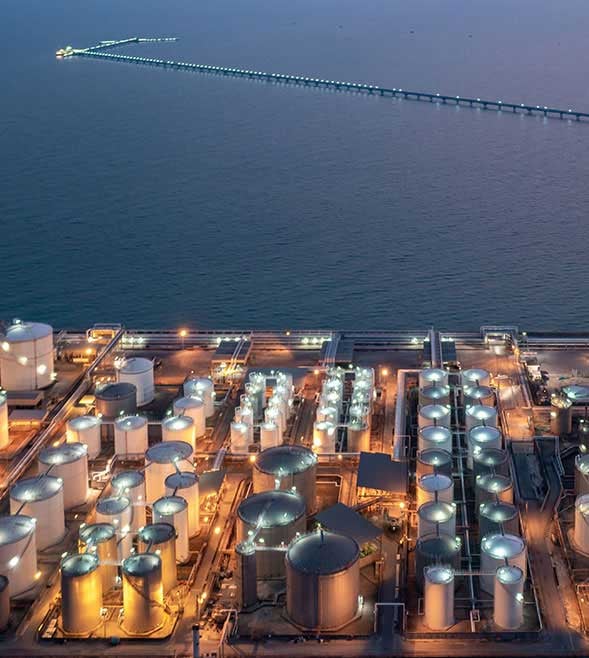
In May 2026, the Greek natural gas market reached a critical inflection point, characterized by a 20% month-over-month (MoM) surge in total NNGTS entries, rising from 5 TWh to 6 TWh.